
Project Canvas tab
On a project’s detail page, the Canvas tab draws every table the project uses as a diagram: the same canvas you know from a workspace, but scoped to the whole project. It shows the same set of tables as the project’s Catalog: everything imported into, or attached to, any of the project’s workspaces.
It draws that set two ways. Lineage is the data-flow picture, and Relationships is an entity relationship diagram of the same tables. A toggle in the page header switches between them, and the rest of this page tells you what each one is for.
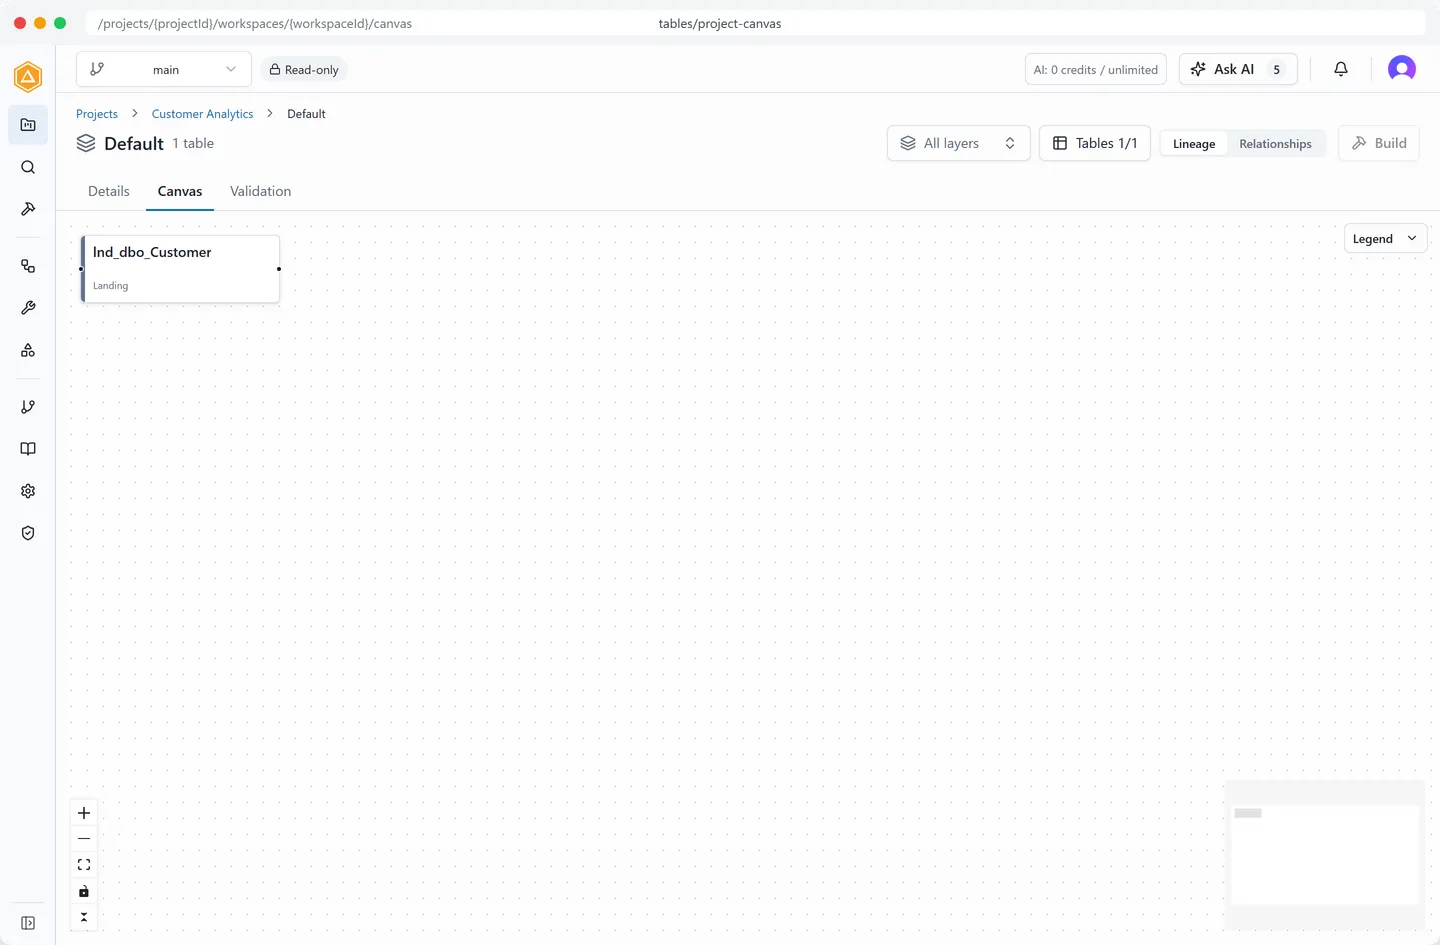 The Canvas tab in Lineage view: the layer filter, the table count, and the view toggle sit in the page header, and each node is tinted by its functional layer.
What you see
Section titled “What you see”In the Lineage view, the canvas lays tables out left to right along their dependency graph and draws a rounded, orthogonal flow edge for every column mapping between two tables. Each edge is a directional connector that points downstream, so a CSV import that fans out into landing, staging, and persistent-staging tables reads as a chain. Every table node is tinted by its functional layer, so you can read a table’s pipeline stage from its color alone. Selecting a node opens the table’s detail rail on the right, exactly as on a workspace canvas.
What a workspace canvas shows instead
Section titled “What a workspace canvas shows instead”A workspace canvas is narrower than this one on purpose. It shows the Data Vault and Data Mart objects modeled anywhere in your organization (hubs, links, satellites, dimensions, and facts), plus every table scoped to that workspace. Modeled objects are the shared vocabulary your whole organization designs against, so a workspace sees them wherever they were built.
Everything else is project plumbing and travels with its scope. Source tables and the pipeline tables an import derives (Landing, Staging, and Persistent Staging) appear on a workspace canvas only where that workspace holds them. If a source or persistent-staging table you expected is missing from a workspace canvas, that is the first thing to check: add it from the workspace’s Catalog, and it appears on the canvas with the rest of your scope. The project canvas keeps showing every table the project uses either way.
How nodes and connectors read
Section titled “How nodes and connectors read”Each table is a compact node tinted by its functional layer (see the colors below). The node shows the table name; its object type (for example Hub, Link, or Satellite) appears when you hover, rather than as a separate badge, so the canvas stays uncluttered. Connectors between tables are drawn as clean lines without text labels and without endpoint dots, so the shape of the dependency graph is easy to follow at a glance. Hover a connector to see how many columns flow across it.
Switch between data flow and relationships
Section titled “Switch between data flow and relationships”Use Lineage to answer “where does this data come from”, and Relationships to answer “what references what”. The toggle in the page header switches between them, and both draw the same set of project tables.
Every connector in the Lineage view is data-flow lineage: one per pair of tables where columns flow from a source into a target. Foreign key relationships are deliberately left out of it, so the chain from source through landing, staging, and persistent staging stays readable.
The Relationships view draws an entity relationship diagram instead. Each table becomes a card listing its primary key, business key, and foreign key columns, and a crow’s foot connector joins every pair of tables where one references the other. It is the same diagram the catalog Canvas tab draws for a connection, catalog, or schema, scoped to your project instead of to a catalog.
Your choice travels in the address, so a link to this tab reopens on the view you were reading. Every project-level action below works from either picture: the right-click menu is the same in both.
The two views keep their own layout. Relationships saves node positions, so a table stays where you drag it and Auto layout on the bottom-left rail rearranges the diagram when you ask. Lineage arranges itself on every load and has no Auto layout button, which is why the rail is shorter there.
To read what references what without leaving a table, open the table and read its Relationships tab. Both surfaces are covered in Table relationships.
Narrow the canvas to a layer
Section titled “Narrow the canvas to a layer”Every relationship in the project at once is rarely the diagram you want. The Layers control in the page header narrows the canvas to one or more functional layers, and it is present in both views. Its trigger names the selection rather than listing it, reading All layers when you have picked nothing. In the Relationships view each option carries its own counts, the tables on that layer and the relationships with both ends on it, so you can tell before you click whether a layer has a diagram to draw at all. Pick Staging and you get the staging tables and the relationships between them, and nothing else.
When there is something to report, a panel floats over the top left of the canvas: the layers you picked, how much is drawn, and how many related tables sit outside those layers. It appears only when it has something to say, so an ordinary canvas carries nothing over it. Those outside tables are held back rather than dropped, because drawing one end of a relationship and not the other would assert something untrue. Choose Show them to bring them onto the canvas, where they stay until you clear the filter.
The layer choice travels in the address alongside the view, so a narrowed diagram is shareable by copying the link. Only the layers your project actually uses are offered, so the list never holds an option that could only empty the canvas.
A relationship whose two ends sit on different layers belongs to neither layer’s count, so the per-layer numbers do not add up to the project total. That is what makes a zero a promise rather than a hint: pick a layer that reads no relationships and you get a field of cards with no connectors, which is exactly what the canvas then tells you it did.
The filter applies to Lineage as well, and the reason it can is worth knowing. A data-flow connector is a chain, so simply dropping a hidden table would leave the picture claiming that columns flow from your source straight into staging, which they do not. Instead the canvas bridges the gap: a path that runs through hidden tables is redrawn as a single dashed connector labelled indirect, so a hidden layer makes exactly the same claim on the picture as a hand-hidden table. You lose the intermediate steps, never the fact that something sat between the two ends.
Above two hundred tables the canvas asks before it draws, because large relationship diagrams are slow to lay out. Narrow the view with Layers and it draws as soon as the set fits, or choose Render anyway to take the whole project at once.
You do not have to find these relationships by hand: see Discover keys and relationships to have AI propose them for you.
Tables and columns on the canvas inherit AI context from their project and from the upstream tables they derive from; see How AI context compounds for which skills read that inherited context and how.
Creating relationships
Section titled “Creating relationships”You can also record a relationship by hand. Right-click a table and choose Add relationship, or drag from one table’s connect handle onto another, to open the relationship dialog. Relationship authoring stays inside one catalog: the Other table picker lists only tables in the same catalog as the source (the same connection and catalog name; schemas within a catalog may differ), and dragging onto a table in another catalog or connection is refused, because a foreign key lives inside a single catalog. When no other table in the catalog qualifies, the picker says so rather than offering an empty list. What you record lands in the catalog and on the table’s Relationships tab, and it draws immediately in the Relationships view of this canvas. The Lineage view keeps showing data flow only. See Table relationships for the full authoring and editing flow.
To let AI find relationships for the table in front of you instead of picking one by hand, choose Suggest relationships in the same dialog. It runs relationship discovery scoped to that one table, and the proposals arrive in the docked Ask AI pane for review; see Discover keys and relationships for how to read and apply them.
Connector styling is configurable
Section titled “Connector styling is configurable”A platform administrator can tune how each type of canvas draws its connectors and arranges its nodes from the Canvas appearance page: the marker style (including crow’s foot notation), the connector style (Bezier, Smooth step, or Straight), the marker size, the line width, the line style, connector colors, and the layout algorithm are all set per canvas type. Table-level and column-level lineage are separate canvas types, so the project canvas and the column lineage view can be styled independently. The project canvas’s two views are two canvas types as well: Lineage is styled as a lineage canvas and keeps its clean left-to-right layered look by default, while Relationships is styled as an Entity Relationship canvas and so inherits crow’s foot notation out of the box, alongside the catalog, business modeling, and view designer canvases.
Layer colors
Section titled “Layer colors”Every table node is tinted by its functional layer, so the pipeline stage reads at a glance without reading a label. The same palette is used on a table’s Lineage tab and in the detail rail.
| Layer | Color |
|---|---|
| Source | Slate |
| Landing | Emerald |
| Staging | Teal |
| Persistent Staging | Indigo |
| Data Warehouse | Rose |
| Data Vault | Sky |
| Data Mart | Cyan |
Data Vault objects (hubs, links, and satellites) are tinted by object type rather than by layer.
Project-level actions
Section titled “Project-level actions”Right-click a table (or select one and use the action menu) to run an action at project scope. Data Vault and the other canvas actions all work here, and their results are written to the project’s Default workspace: a workspace DeltaVault maintains for each project as the home for project-scope work. The tables an action produces therefore appear in three places at once: on this project canvas, on the project’s Catalog page, and on the Default workspace’s own canvas.
You don’t choose or manage the Default workspace; every project has exactly one, and DeltaVault creates it automatically. If a project never had one, it is created the first time you act on the project canvas.
Deleting from the project canvas
Section titled “Deleting from the project canvas”Deleting a table on the project canvas means remove it from the project, not delete its metadata. DeltaVault confirms, then removes the table from the project and from any workspaces that still use it: the same cascade as Remove from project on the Catalog. The table stays in your Catalog and can be re-added later by attaching it to one of the project’s workspaces. (To soft-delete the table itself, use the delete action on a workspace canvas instead.)
Project-level actions require the editor role and a feature branch. They are disabled for viewers and on the main branch, where everything is read-only: switch to a branch to make changes, consistent with other write actions across DeltaVault.